Showing posts with label OBIAPPS. Show all posts

Sunday, March 8, 2015

Consolidating on-premise and public cloud data on Oracle BI Apps


With an increase in the adoption of cloud applications by large corporations, most organizations today are in some form of hybrid state i.e. they are using a combination of both on-premise as well as cloud applications to run their business.

Regardless of where the applications maintain their data, organizations need the ability to see a complete view of the company spanning across different parts of the business, which in this case would be combining insightful data across on-premise as well as public cloud instances.

To take some examples:

1.     Combining HR and Financials data to analyze Revenue per employee
2.     Combining Sales and Financials data to create customer Scorecards
3.     Combining Sales and Order Management data to improve your demand planning system
4.     Combining your Sales and Financials Data for Forecasting

In this article, I would like to present multiple design approaches that other organizations have successfully used to consolidate data from multiple cloud and on-premise applications and to perform seamless analytics across these varied data sources.

If you are attending Collaborate15 (#C15LV), please join me to discuss this topic and case studies of what other organizations are doing to address this challenge. 

What is Cross Functional analysis?

Cross functional analysis is the ability to gather valuable business insights by efficiently joining both CRM and ERP data that are used to run front-office and back-office applications for an organization.


Shown in Figure 1 below is an example of cross functional analysis used to build a “Quarterly Revenue Forecast Report” for a Services Company that has three Business Units and Runs Oracle Cloud to manage its CRM and Oracle EBS to manage its Financial Processes.
Figure 1

Data Consolidation Options

There are multiple options you could consider to fulfill cross functional analysis by pulling information from a variety of source systems. Here, I would like to discuss the following two options:

1.     Consolidating all your insightful data on Oracle Business Analytics warehouse and using on-premise OBIEE to perform analysis
2.     Consolidating your data on Oracle Cloud Database schema and using Oracle BI Cloud Service (BICS) to perform analysis

The top half of Figure 2 below shows multiple cloud applications. The top lefts shows various cloud applications where data is generated and hosted. The top right shows the current Oracle cloud analytics platform that can be used to perform reporting.

Likewise, the bottom left shows multiple on-premise applications that create data on an on-premise instance. The bottom right shows OBI Application being used to perform reporting.

Figure 2


Option 1 - Consolidating all your insightful data on Oracle Business Analytics warehouse and using on-premise OBIEE to perform analysis

If you’re using all on-premise applications to run your business, you can use your existing Oracle BI Applications ETL process to extend into non-oracle data sources.

If you’re in a Hybrid state using some cloud applications to run certain parts of your business, you can use cloud ETL (Extract, Transform and Load) tools to move your data onto on-premise staging tables, followed by Oracle’s prebuilt adaptor to push the data onto corresponding Star Schemas.

You might want to choose option 1 to move your public cloud data (Salesforce, NetSuite, Oracle Applications cloud) on to Oracle Business Analytics warehouse (OBAW) if you have already deployed Oracle BI Application and are using its Data Model to consolidate to non-Oracle data sources.


Data Movement Technology

There are number of technologies you can use to move your public cloud data to an on-premise Data Warehouse staging table. Oracle has recently released a number of technologies and approaches that can be used for this purpose. The technology to move data between Cloud and On-prem instances is constantly evolving.

As shown in Figure 3 below, in order to consolidate the data into an on-premise Oracle Business Analytics Warehouse,  we would continue to use Oracle’s pre built adaptor to go on to oracle ERP sources, and use one of the newly released Data Movement technologies to move data from cloud to a common staging table. 
Figure 3

Design Considerations

1.     Use Staging tables to consolidate data from multiple applications(on-premise /public cloud)
2.     Leverage BI Apps Data Model
3.     Leverage Common dimensions for analysis across applications
4.     Assign Unique Data Source Number for each distinct applications


Option 2 - Consolidating your data on Oracle Cloud Database schema and using Oracle BI Cloud Service (BICS) to perform analysis

If you are considering cloud to build your enterprise analytics platform, there are number of Data Movement technologies that can be used to consolidate your data on Oracle’s cloud based database schema service.

The approach here would be similar to the one discussed in Option 1, the difference being, we will consolidate the data on Oracle Cloud based Data Base schema Service. 

Figure 4

Cloud technology is the next critical evolutionary step in software. It’s a trend that has momentum to become the dominant platform of the future. If you are interested in learning more about why you should consider cloud to build your enterprise analytics platform, you can view my earlier post here  on modernizing your analytics platform on Oracle BI Cloud Service.


Monday, September 22, 2014

Fulfilling Real-Time analytics on Oracle BI Applications platform

Analytics users have always had the desire to get “real-time” data.  There are certain business scenarios where the ability to do real-time analysis can positively impact different areas of our Business – from increased revenue to a greater customer satisfaction.

Most of the Oracle BI Application deployments my team and I have been a part of, have always had some Real-Time components.There are a number of design approaches to extend the Oracle BI applications foundation in order to fulfill these requirements. In this article, I would like to share one of the design approaches I will be presenting with my colleague during Oracle OpenWorld 2014. If you are visiting the Oracle Open World this year, please join us to discuss this topic and any other questions on Oracle Business Intelligence:

Session ID: CON6485
Session Title: Leverage Oracle BI Applications Architecture to Meet Real-Time Reporting Requirements
Venue / Room: Moscone West - 3011
Date and Time: 10/1/14, 16:30 - 17:15

What is “Real-Time Analytics”?
Real-time business intelligence (RTBI) is the process of delivering information about business operations as they occur. Real time means near to zero latency and access to information whenever it is required.
- Wikipedia
Some of the common business scenarios for real-time analytics we always run into are:
§  Access to Point Of Sale transactions to efficiently manage Inventory and Store Cash
§  Operational reports for Business that depend on timely deliveries
§  Users simply need critical operational data in real-time

Let’s take a look at the design approach to fulfill real-time analytics on Oracle BI applications Platform
For those of you who are not familiar with Oracle BI Applications, It is a pre-packaged and prebuilt BI tool that enables organizations to realize the value of a packaged BI Application, such as rapid deployment, lower TCO, and built-in best practices, while also being able to very easily extend those solutions to meet their specific needs, or build completely custom BI applications, all on one common BI architecture.

Business Requirement: Show me the list of Order Quantity by Customer and Product in real Time.
In order to fulfill this requirement, we will extend the OBIEE metadata to seamlessly integrate data from two data sources:
1.       Oracle Business Analytics Warehouse (OBAW) for historical data (This would be the data loaded as of the night before)
2.       Transactional Data (OLTP).
Figure- 1

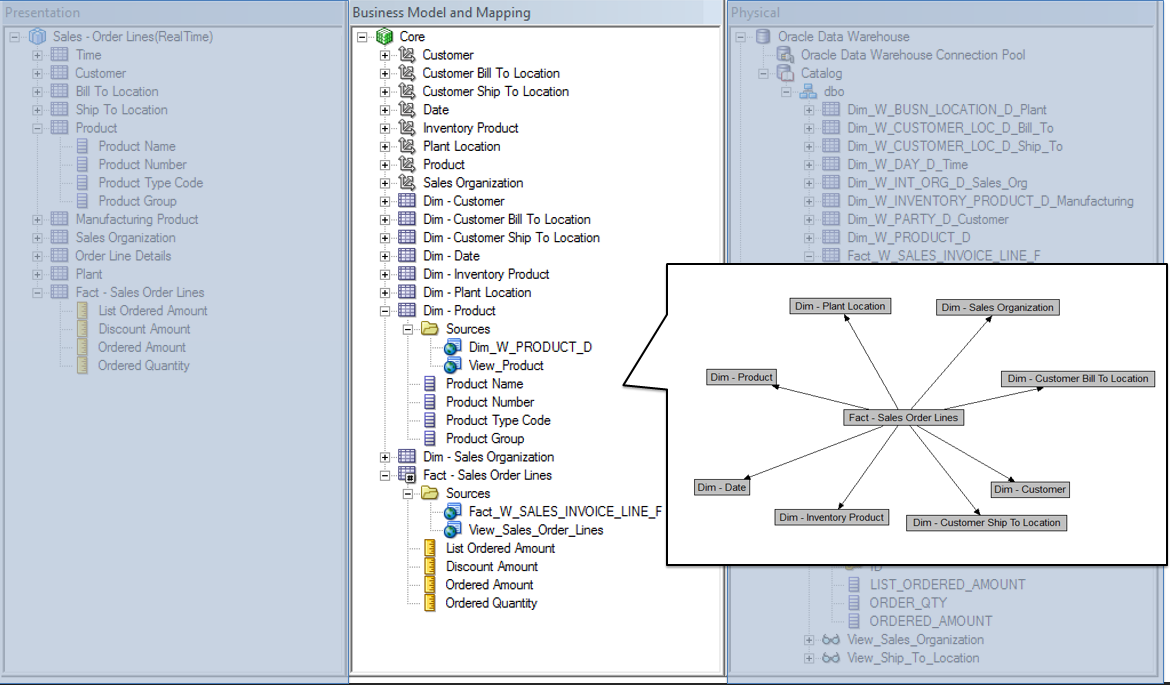
The Physical layer is an exact depiction of the target physical database(s). Figure 2 shows an Out of the Box (OOTB) Sales Invoice Line Fact and its relationship with OOTB Dimensions.

Figure- 2

Similarly, in order to access the real-time data, we created views in our transactional system that would store transactions occurred since the nightly load. Now, based on the real-time reporting requirement, we may need to create multiple views depending on the number of dimensions we want our users to be able to seamlessly analyze and slice real-time data. As you can see in figure 3, we created seven dimensional views in order to provide the ability to slice real-time data by those dimensions.
Figure- 3

The Business Model is a layer of abstraction that sits on top of the physical data. The Business Model allows us to collapse multiple dimension tables or multiple fact tables coming from disparate physical sources into a single logical table.  As you can see in Figure-4, there is one Logical Fact and One Logical Dimension for two disparate sources (OBAW and OLTP).
The Business Model also contains some of the rules for how the databases should be interrogated.  If the application contains Aggregate or Partitioned database tables used to improve query response times, these rules would be defined within the Logical Table Sources within the Business Model.   We will leverage this functionality to federate data from two Physical data sources.

Figure- 4

We need to map the Physical column for each Logical Table sources. As you can see in Figure-5, Ordered Amount is mapped to NET_AMT for W_SALES_INVOICE_LINE_F (OBAW Fact Table) and ORDERED_AMOUNT for View_Sales_Order_lines_Fact (OLTP Table).

Figure- 5

Similarly, we need to map the Physical column for each Dimensions, Logical Table sources.


Figure- 6

The Presentation layer is a second layer of abstraction that sit-on-top of Business Model. The Presentation layer is presented to end-users in a complete WYSIWYG framework. 


Figure- 7
 Per the design steps completed above, when we try to create a report. OBI generates queries for each data source. Data returns from each data source. Data is then integrated on the OBI Server before displaying it to the users.

Figure- 8

Below is a 3-Tier architecture diagram to fulfill real-time and analytical reporting need without adversely impacting the ERP (Business) Applications.

Figure- 9

Monday, November 2, 2009

Understanding Oracle BI Application(OBIApps) methodology of deriving AGO Measures

Very often I have members from the IT team at Customer site asking me the question on how to customize OBIApps in order to derive Ago(Year,Quarter,Month,Day) Measures, which are not delivered Out of the Box(OOTB) .Of course there is a Time series function(AGO) in OBIEE which can be leveraged to fulfill these requirements , but in this article I would like to explain the OOTB approach that is taken to derive AGO measures. Getting familiar with OOTB approach and the underlying Data Model that is there to support similar requirements, can help us follow similar methodology for our customization.

In this article I have takenOracle BI Application 7.9.6>Human Resources>Workforce Profile Subject area as an example for understanding the Concepts.

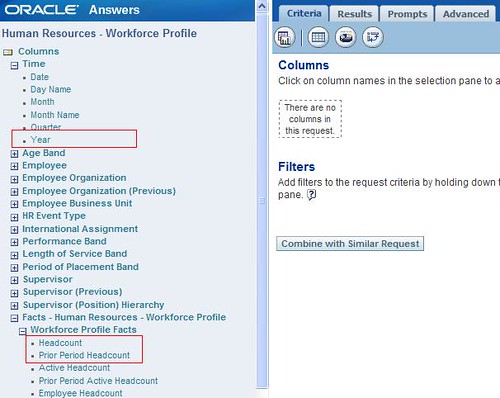
1.Below is the Screnshot of the OOTB Human Resources>Workforce Profile Subject Area .

2. Building a quick report with the Metrics above displays the results as below .

Note that Prior Period Headcount for 2006 is equivalent to Headcount value of 2005.

3. Let us now look into the design . Open the OOTB RPD and expand the Human Resource - Workforce Profile Presentation Catalog. Scroll Down and further expand the Presentation Table Workforce Profile Facts you should notice the two Presentation Columns Headcount and Prior Period Headcount .

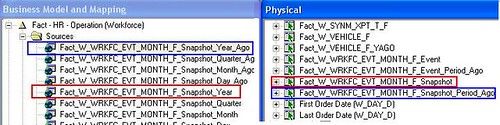
4. These two Presentation columns are mapped to different Logical Table Sources as listed below
Fact_W_WRKFC_EVT_MONTH_F_Snapshot_Year
Fact_W_WRKFC_EVT_MONTH_F_Snapshot_Year_Ago
Fact_W_WRKFC_EVT_MONTH_F_Snapshot_Quarter
Fact_W_WRKFC_EVT_MONTH_F_Snapshot_Quarter_Ago
Fact_W_WRKFC_EVT_MONTH_F_Snapshot_Month
Fact_W_WRKFC_EVT_MONTH_F_Snapshot_Month_Ago
Fact_W_WRKFC_EVT_MONTH_F_Snapshot_Day
Fact_W_WRKFC_EVT_MONTH_F_Snapshot_Day_Ago


5.Further drilling down into the Physical Layer reveals that the above logial table sources are derived from the two Physical Table Aliases of the same table W_WRKFC_EVT_MONTH_F.

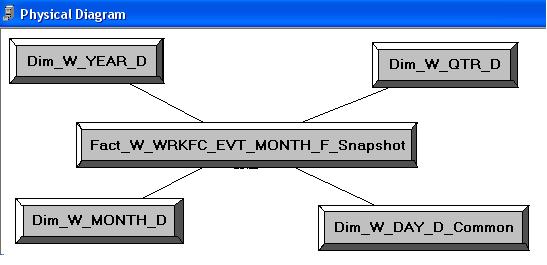
6.Below is the Physical Diagragm of the alias Fact_W_WRKFC_EVT_MONTH_F_Snapshot joinining with the Time Dimensions.

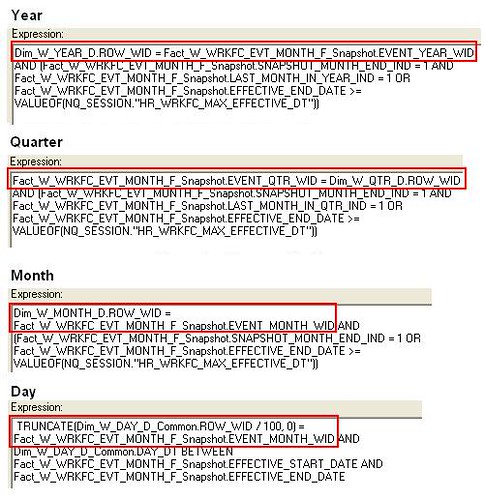
7.Below is the expression definition used in the join criteria . Note that ROW_WID of Year,Quarter,Month and Day Dimensions are used to join with the Fact table alias.

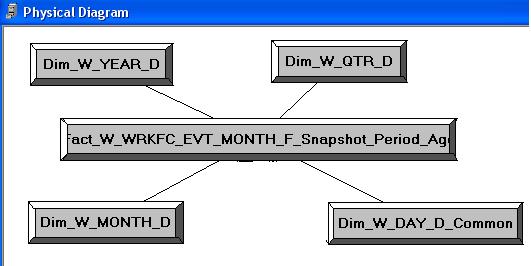
8.Below is the Physical diagram of the alias Fact_W_WRKFC_EVT_MONTH_F_Snapshot_Period_Ago joining with the Time Dimensions.

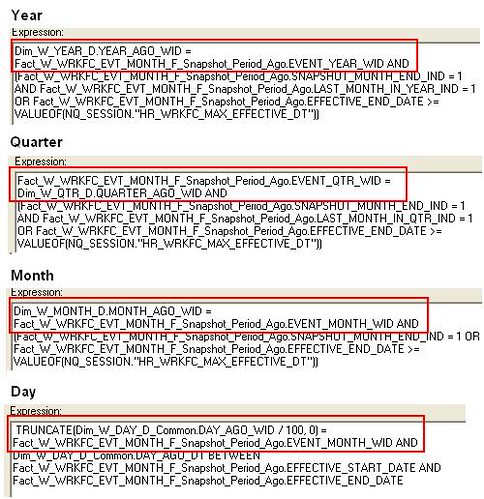
9.Below is the expression definition used in the join criteria . Note that YEAR_AGO_WID,QUARTER_AGO_WID,MONTH_AGO_WID and DAY_AGO_WID are used to join with the Time Dimensions.

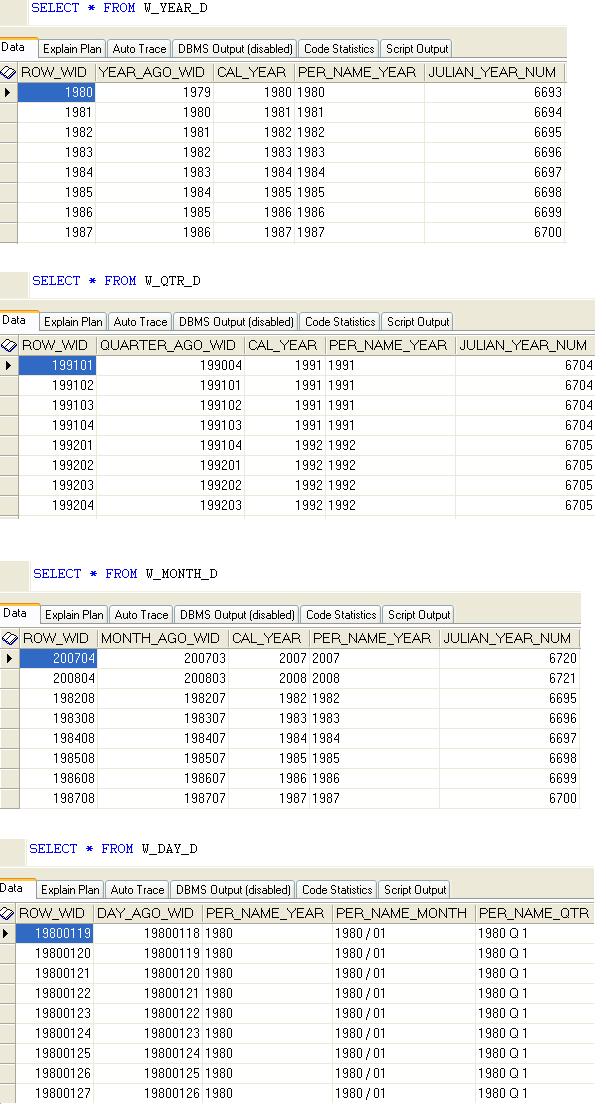
10.Let us now analyze the Data of the Time Dimension. As you can notice below the Data Model is in place which can be used to join and derive AGO measures.

11.Similar approach can be followed during Oracle BI Application(OBIApps) Customization for deriving ago measures which are not present Out of the Box(OOTB).

Saturday, October 10, 2009

Setting Up OBIEE Metadata Dictionary

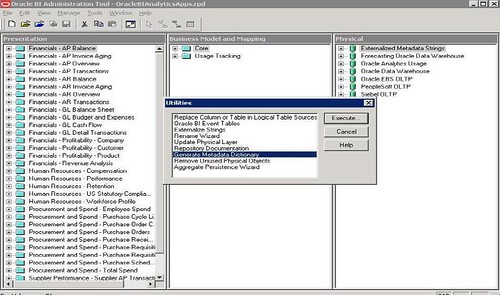
1.Open the RPD>Tools>Utilities>Generate Metadata Dictionary>Execute.

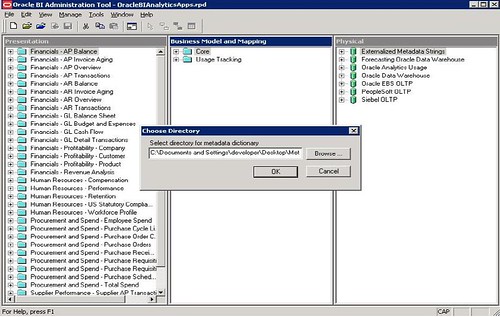
2.Browse to a location where you would like to save the
metadata dictionary.

3.You will see a message informing you that the metadata
dictionary has been succesfully created .

4.Now we need to tell the presentation server where to find the
dictionary. Navigate to OracleBIData\Web\Config and open the
file 'instanceconfig.xml'
Add


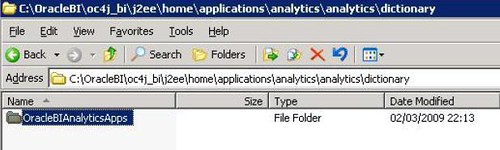
5.Navigate to C:\OracleBI\oc4j_bi\j2ee\home\applications\analytics\analytics and
create a folder 'dictionary' and copy and paste the metadata dictionary folder 'OracleBIAnalyticsApps' inside this folder.

6.Restart the following
Oracle BI Server
Oracle BI Presentation Services
Oracle BI Java Host
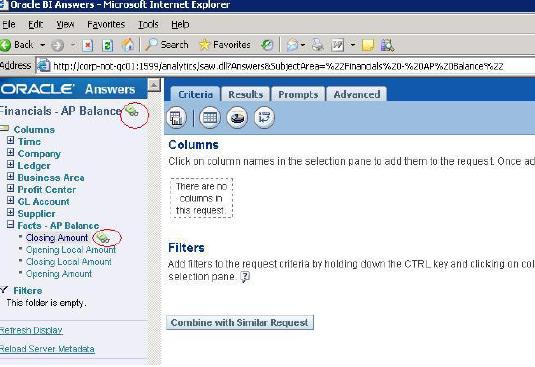
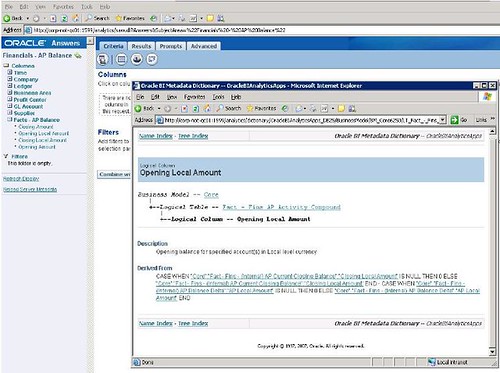
7. When you scroll by any column you should be able to see the
definition of the column. You can also click on the green icon to
see futher details specific to that column.