
Analytics users have always had the desire to get “real-time” data. There are certain business scenarios where the ability to do real-time analysis can positively impact different areas of our Business – from increased revenue to a greater customer satisfaction.
Most of the Oracle BI Application deployments my team and I have been a part of, have always had some Real-Time components.There are a number of design approaches to extend the Oracle BI applications foundation in order to fulfill these requirements. In this article, I would like to share one of the design approaches I will be presenting with my colleague during Oracle OpenWorld 2014. If you are visiting the Oracle Open World this year, please join us to discuss this topic and any other questions on Oracle Business Intelligence:
Most of the Oracle BI Application deployments my team and I have been a part of, have always had some Real-Time components.There are a number of design approaches to extend the Oracle BI applications foundation in order to fulfill these requirements. In this article, I would like to share one of the design approaches I will be presenting with my colleague during Oracle OpenWorld 2014. If you are visiting the Oracle Open World this year, please join us to discuss this topic and any other questions on Oracle Business Intelligence:
Session ID: CON6485
Session Title: Leverage Oracle
BI Applications Architecture to Meet Real-Time Reporting Requirements
Venue / Room: Moscone West -
3011
Date and Time: 10/1/14, 16:30 -
17:15
What is “Real-Time
Analytics”?
Real-time business intelligence (RTBI) is the process of
delivering information about business operations as they occur. Real time means
near to zero latency and access to information whenever it is required.
- Wikipedia
Some of the common business scenarios for real-time
analytics we always run into are:
§
Access to Point Of Sale transactions to
efficiently manage Inventory and Store Cash
§
Operational reports for Business that depend on
timely deliveries
§
Users simply need critical operational data in
real-time
Let’s take a look at
the design approach to fulfill real-time analytics on Oracle BI applications
Platform
For those of you who are not familiar with Oracle BI
Applications, It is a pre-packaged and prebuilt BI tool that enables
organizations to realize the value of a packaged BI Application, such as rapid
deployment, lower TCO, and built-in best practices, while also being able to
very easily extend those solutions to meet their specific needs, or build
completely custom BI applications, all on one common BI architecture.
Business
Requirement: Show me the list of
Order Quantity by Customer and Product in real Time.
In order to fulfill this requirement, we will extend the
OBIEE metadata to seamlessly integrate data from two data sources:
1.
Oracle Business Analytics Warehouse (OBAW) for
historical data (This would be the data loaded as of the night before)
2.
Transactional Data (OLTP).

Figure- 1
The Physical layer is an exact depiction of the target
physical database(s). Figure 2 shows an Out of the Box (OOTB) Sales Invoice
Line Fact and its relationship with OOTB Dimensions.

Figure- 2
Similarly, in order to access the real-time data, we created
views in our transactional system that would store transactions occurred since
the nightly load. Now, based on the real-time reporting requirement, we may
need to create multiple views depending on the number of dimensions we want our
users to be able to seamlessly analyze and slice real-time data. As you can see
in figure 3, we created seven dimensional views in order to provide the ability
to slice real-time data by those dimensions.

Figure- 3
The Business Model is a layer of abstraction that sits on
top of the physical data. The Business Model allows us to collapse multiple
dimension tables or multiple fact tables coming from disparate physical sources
into a single logical table. As you can
see in Figure-4, there is one Logical Fact and One Logical Dimension for two
disparate sources (OBAW and OLTP).
The Business Model also contains some of the rules for how
the databases should be interrogated. If
the application contains Aggregate or Partitioned database tables used to
improve query response times, these rules would be defined within the Logical
Table Sources within the Business Model.
We will leverage this functionality to federate data from two Physical
data sources.
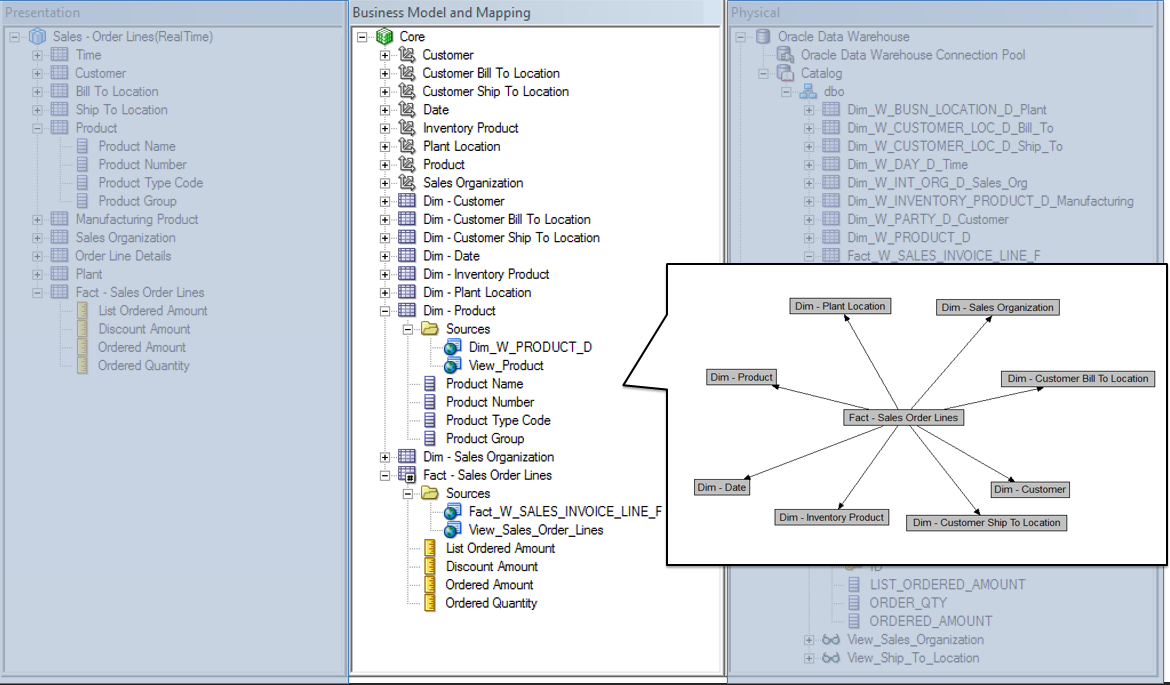
Figure- 4
We need to map the Physical column for each Logical Table sources.
As you can see in Figure-5, Ordered Amount is mapped to NET_AMT for
W_SALES_INVOICE_LINE_F (OBAW Fact Table) and ORDERED_AMOUNT for
View_Sales_Order_lines_Fact (OLTP Table).

Figure- 5
Similarly, we need to map the Physical column for each
Dimensions, Logical Table sources.

Figure- 6
The Presentation layer is a second layer of abstraction that
sit-on-top of Business Model. The Presentation layer is presented to end-users
in a complete WYSIWYG framework.

Figure- 7

Figure- 8
Below is a 3-Tier architecture diagram to fulfill real-time
and analytical reporting need without adversely impacting the ERP (Business)
Applications.

Figure- 9